
Introducing Enhanced Logging and the New Invocations View
Ampt's enhanced logging enables a new "Invocations" view that lets developers get better insights into their AWS workloads.
 Jeremy Daly
Ampt's primary goal is to remove as much undifferentiated heavy lifting from the cloud development process as possible. What separates us from other services is our AWS native-first approach to deploying applications to the cloud. We love third-party services and recommend using them when it makes sense. But Ampt remains committed to providing users with a variety of productized patterns that deploy workloads directly to AWS native services. This removes arbitrary limits and bottlenecks and gives our users access to the full power and scalability of AWS.
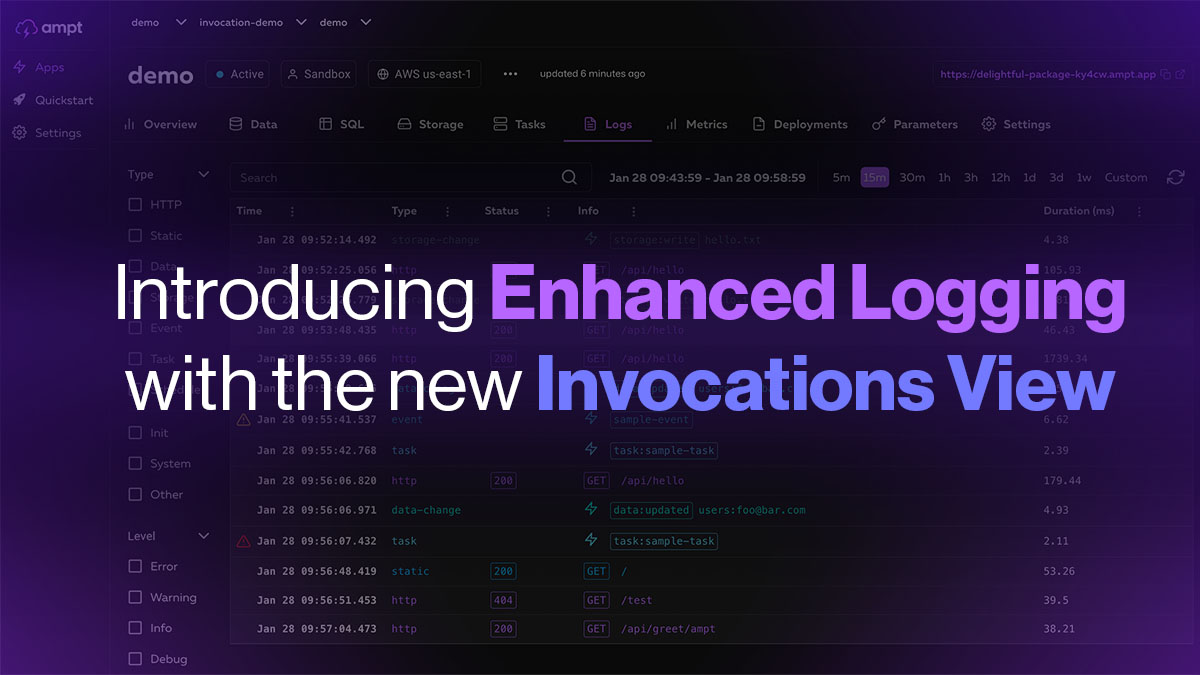
Today we're excited to announce improvements to Ampt's logging capabilities and a new "Invocations" view to make observing and debugging applications even easier. We've also added invocation type filters, a powerful structured log search, and an invocation detail view with request type specific meta data and aggregated logs.
Observability Challenges on AWS
Observability still remains one of the most challenging components to implement natively on AWS. Amazon CloudWatch has evolved over the years into a highly sophisticated and flexible APM tool that includes logs, metrics, tracing, alerting, and much more. But that also comes at the cost of added complexity and significantly more configuration required by developers. This is the main reason third-party observability tools like Baselime, Lumigo, Datadog, Honeycomb, and others thrive on AWS's deficiency in this space.
Ampt supports different levels of integration with third-party observability providers, but our AWS native-first approach drives us to extract as much value out of AWS as possible. This means both automatically implementing and leveraging Amazon CloudWatch in applications deployed with Ampt AND providing developers with actionable insights using built-in tools for data visualization and analyzation. We're not a full-featured observability tool, but it's critical for users to have proper visibility into their applications.
Organizing by Invocations
Logs are a very useful debugging tool, especially when they can be aggregated from multiple sources within a distributed system. However, logs can also be noisy. A stream of raw logs without proper organization makes it difficult to surface useful information about particular requests. This can dramatically minimize value and also makes for a less-than-ideal developer experience.
Ampt took a "raw logs" approach because this is how Amazon CloudWatch stores and returns log data. We automatically applied logging best practices, like automatic structuring, plus we enriched log entries with additional request information to help users better understand the context. As heavy users of our own service (the Ampt Dashboard, our marketing automation system, this website, and several other internal projects are built using Ampt), we were becoming increasingly frustrated by the lack of log usability. More importantly, our users shared the same feedback.
Modern observability tools have standardized on an "invocation" view, and for good reason. Visualizing "invocations" presents a much clearer picture of how your application is being utilized and provides structure to organize logs by request. Retrieving the necessary data to render this type of view is trivial when backed by Elasticseach or a wide column datastore. However, getting this data directly from Amazon CloudWatch is an entirely different challenge.
Logs Enrichment to the Rescue
As mentioned earlier, Ampt was already automatically enriching log rows with additional request context. However, this still left users responsible for logging other potentially important details. Information such as the HTTP request path and response status for API requests, or the filename that triggered a storage listener, were only captured if the user specifically logged them. This was by design, as we wanted to give users full control over their logs. What we've learned is that this tradeoff meant much less visibility and a suboptimal developer experience.
The Ampt runtime includes extensions for processing, compiling, and shipping telemetry data. This allows Ampt to monitor and optimize applications. With our latest update, Ampt is now capturing type-specific information for each request and aggregating it into a single invocation log entry. This includes the request duration, a cold start indicator, and these additional details:
- HTTP request path, method, and response status
- Data change event type (created, updated, deleted) and item key
- Scheduled task name
- Static asset request path, method, and response status (for dev sandboxes)
- Event name
- Storage listener event type (write, remove) and filename
- Task name
- Log level counts to identify invocations with warnings and errors
We are also capturing system events, initialization logs emitted outside of handlers, and other error logs that are useful for debugging. We've optimized these logs to minimize storage requirements while still providing users with the ability to add custom logs using standard console logging methods.
Faster Logs using Direct CloudWatch Access
Ampt has been leveraging CloudWatch logs since the beginning, but securely proxying the Ampt dashboard to the underlying CloudWatch logs in a user's AWS account was inefficient and sometimes painfully slow. In order to speed this up, we now create short-lived, tightly-scoped access keys that can query the CloudWatch API directly. This displays the log data on the dashboard as fast as the CloudWatch service can return it.
From a security perspective, each access key is limited to the Ampt environment that it's connected to. This ensures that users only have access to the CloudWatch logs that they need to. And since every Ampt environment runs in its own isolated AWS account, there is an additional bulkhead between developer sandboxes, preview environments, and permanent stages. Access keys are set to expire after 15 minutes. When logged into the Ampt dashboard, the keys are automatically renewed to provide a seamless viewing experience.
What's Next?
We believe these new capabilities greatly enhance the developer experience and allow users to more easily understand the behavior of their workloads without requiring third-party add-ons. These updates are available immediately to all users. We are also working on deeper integrations with vendors like Datadog and Baselime to provide users with additional observability options.
As always, we remain committed to providing users with the control and flexibility to take full advantage of AWS without all the added complexity. Your feedback remains critical to helping us shape the future of cloud development, so please join our community on Discord to share your thoughts.